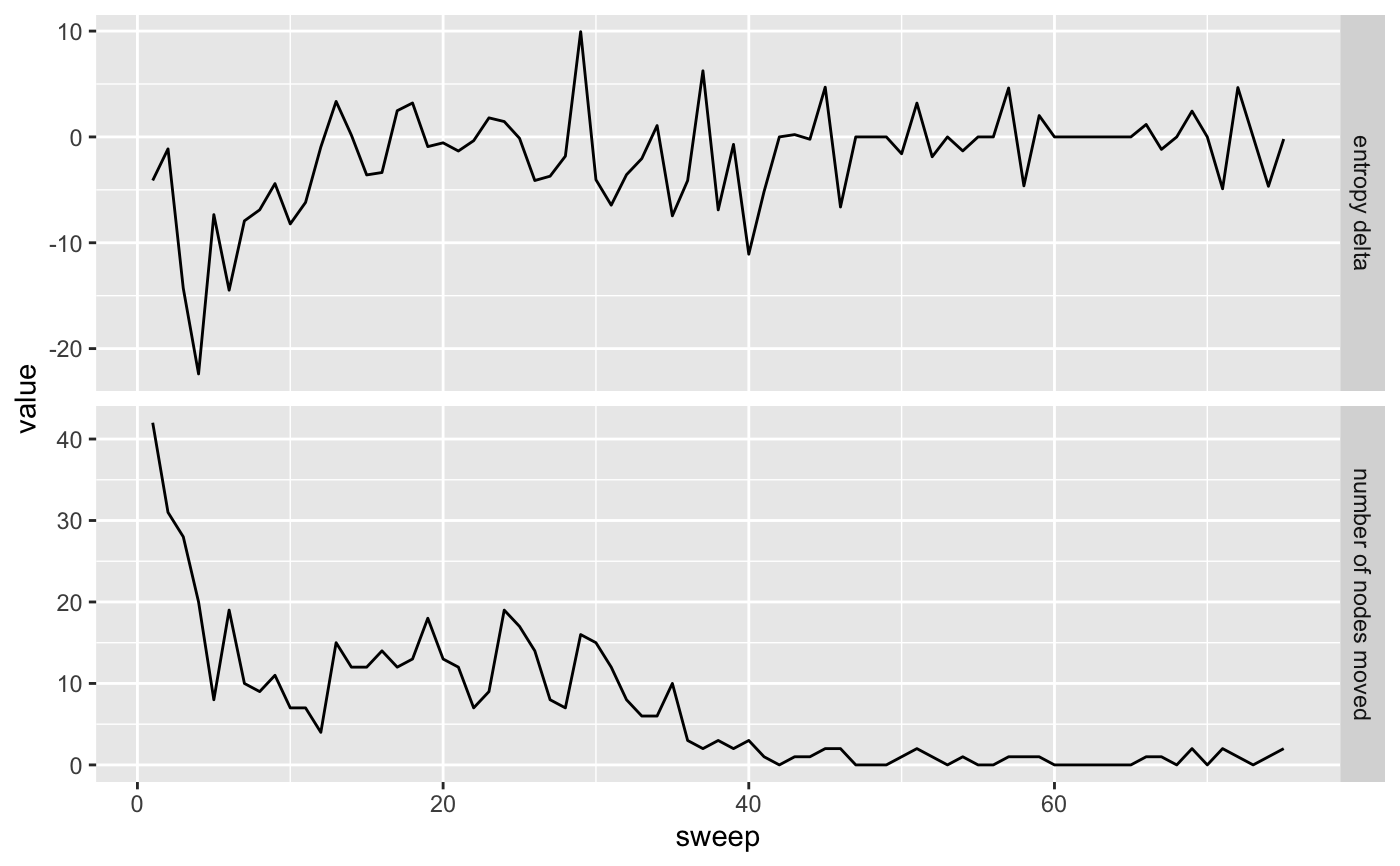
A simple line plot showing both the entropy delta and the number of nodes
moved for each sweep. sbmr::mcmc_sweep() must be run on object before this function.
visualize_mcmc_trace(sbm)
Arguments
| sbm | Object of class |
|---|
Value
GGplot line plot with x-axis as sweep number and y-axes as sweep entropy delta and number of nodes moved during sweep.
See also
Other visualizations:
visualize_collapse_results(),
visualize_network(),
visualize_propensity_dist(),
visualize_propensity_network()
Examples
# Simulate a model and run mcmc sweeps on it
net <- sim_basic_block_network(n_blocks = 3, n_nodes_per_block = 25) %>%
  initialize_blocks(3) %>%
  mcmc_sweep(num_sweeps = 75, track_pairs = TRUE)

# Plot results
visualize_mcmc_trace(net)